July 23, 2026
-
11
min read
Even Perfect Code Generation Leaves 80% of Engineering Untouched
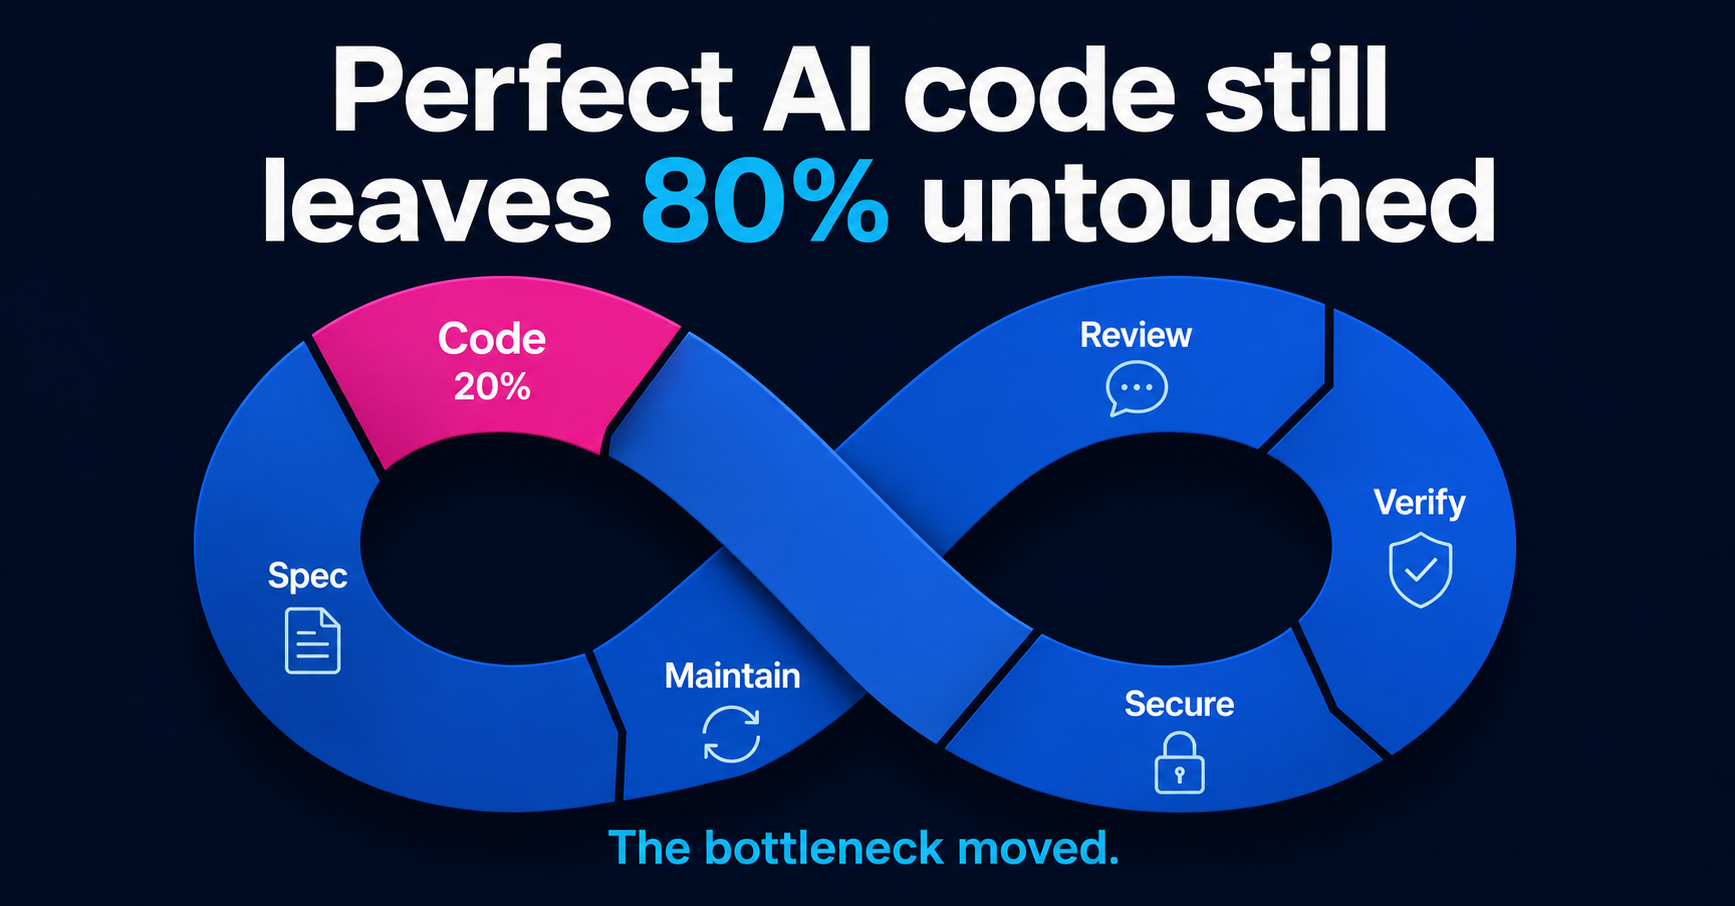
Why automating the most visible part of the job did not automate the largest one: where the bottleneck moved, and how to tell whether your agents are actually getting better.
Most arguments about AI and software engineering are arguments about model capability. Is the code good enough? Will the next model close the gap?
I want to make an argument that does not depend on the answer.
Assume code generation is solved. Not "pretty good." Solved. Perfect code, first time, every time, for any specification you hand it. Under that assumption, how much of software engineering have you automated?
Roughly twenty percent. And the ceiling that implies is about 1.25x.
That is not a claim about today's models. It is a claim about the shape of the work, and it is checkable against research that predates the current generation of tooling entirely.
Before asking what AI removes, it is worth asking what was there.
The most granular recent measurement is Microsoft Research's Time Warp study (November 2024), a survey of 484 individual-contributor developers across sixteen activity categories. Their actual workweek broke down as follows:
Other studies land differently. Sonar's developer survey puts code writing at 32%, with another 35% on "managing code" (19% maintenance, 12% testing, 4% security) and 23% on meetings and operations. IDC's 2024 estimate is 16%. Infragistics says 43%.
That spread, from 11% to 43%, is almost entirely definitional. "Coding" can mean net-new keystrokes, or it can quietly absorb debugging, refactoring, testing, and code reading. Anyone citing a single number has picked a definition. The defensible statement is a band: 10% to 35% of an engineer's week, with 20% a reasonable working assumption.
So the arithmetic. Remove 100% of a component that is 20% of the system, total work falls to 80%, and the speedup ceiling is 1.25x.
This is Amdahl's Law applied to a job description. It is the ceiling under the most generous possible assumption about code generation, and before accounting for any work the new tooling creates.
Two details make the picture sharper. First, the same Microsoft study asked what an ideal week would look like: developers wanted 20% coding and 15% architecture, more of both. The pre-AI complaint was never "I type too slowly." Second, Sonar found maintenance consumes 19% of engineering time on average but 32% at organizations with more than 500 developers. The cost of owning code scales superlinearly with the codebase. Hold that thought, because it returns.
The remaining work is not a residual category. It has structure, and the structure predicts where pressure lands.
Upstream sits specification and architecture. In the Microsoft data these are small, with architecture around 6%, but they are the two activities developers most wanted more time for, and they determine whether everything downstream is worth doing at all.
Cheap code generation changes their economics sharply. When implementation was expensive, a vague specification was expensive to act on, and that cost was a natural brake. Someone would ask a clarifying question before writing the code. When implementation is nearly free, a vague specification produces a confident, complete, plausible implementation of the wrong thing, at volume, in minutes. The brake is gone. Specification quality stops being a nice-to-have and becomes the input that determines everything else.
Downstream sits review, verification, security, and maintenance. This is where the volume arrives, and where the measurable damage is.
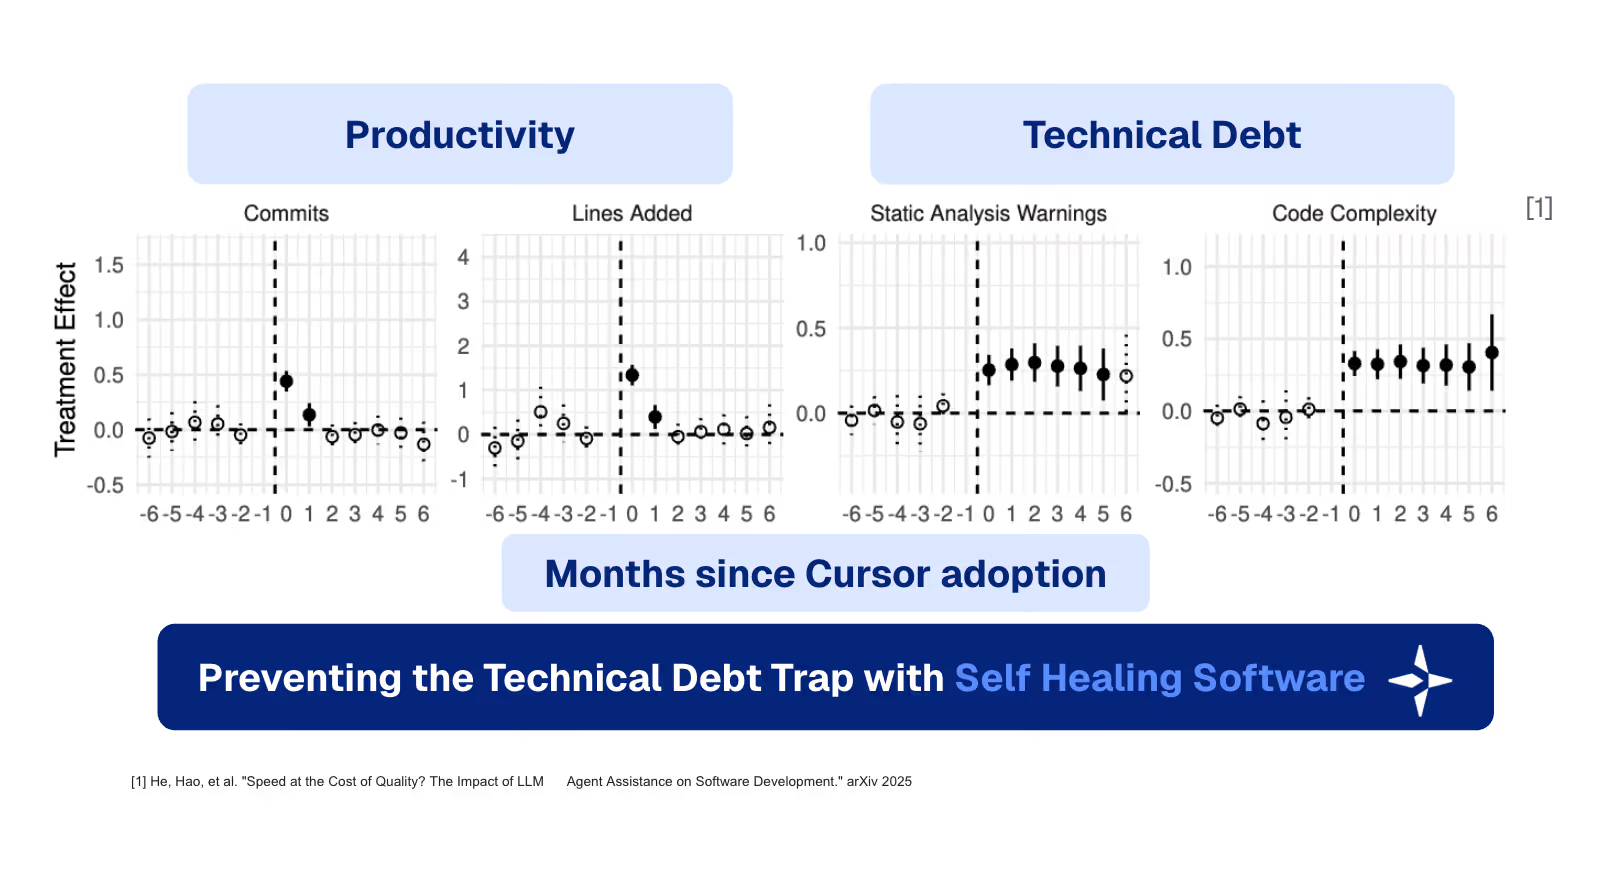
Adoption is essentially universal, so this is not hypothetical. Google Cloud's 2025 DORA report, covering nearly 5,000 technology professionals, found 90% using AI at work, at a median of two hours a day. Sonar's 2026 survey puts AI at 42% of committed code, with respondents expecting 65% by 2027.
Faros AI, drawing on telemetry from more than 10,000 developers across 1,255 teams, found that high-AI-adoption teams completed 21% more tasks and merged 98% more pull requests. PR review time rose 91%. And the number that should worry you most: 31% more PRs merged with no review at all.
LinearB's 2026 benchmarks, built from 8.1 million pull requests across 4,800 organizations in 42 countries, add detail:
Sit with that acceptance rate. Roughly two in three agent-authored pull requests never merge. Each one still consumed a specification, a context window, a CI run, and, most expensively, a reviewer's attention.
CircleCI's 2026 data completes the picture: feature-branch throughput up 59% year over year, while main-branch throughput for the median team actually fell. Work in progress rose. Work shipped did not.
The mechanism is not mysterious. Generation cost dropped by roughly an order of magnitude. Human review speed is a biological constant of about 200 to 400 lines per hour. Double the input to a fixed-rate process and you get a queue, and queues fail nonlinearly. LinearB's pickup delay is that queue becoming visible.
There is also a cost category that no pre-2023 time study has a bucket for. Stack Overflow's 2025 survey of 49,009 developers found the top frustration, cited by 66%, is output that is "almost right, but not quite," with 45% saying debugging AI-generated code takes longer than expected. Trust in AI accuracy fell from 40% to 29%, and experienced developers are the most skeptical, at 2.6% "highly trust."
Reviewing a colleague's pull request came with a colleague you could ask. An agent's diff arrives finished, with no decision trail, and the reviewer has to reconstruct intent from the ticket alone. That reconstruction is new work, and it scales with volume.
Throughput is the visible half. Structure is the invisible half.
GitClear has tracked code-change signals across 623 million analyzed changes from 2023 to 2026. Measured against a 2022 baseline:
Refactored code fell from 21% of changed lines in 2022 to 3.8% in 2026. Developers are now roughly five times more likely to duplicate than to refactor, a full inversion from 2022, when the preference ran two to one the other way.
Security runs parallel. Veracode tested more than 100 models across 80 coding tasks and found that 45% of generated code introduced an OWASP Top 10 vulnerability, rising to 72% in Java. Larger models were not safer, which makes this systemic rather than a scaling problem. Apiiro's Fortune 50 analysis found CVSS 7.0+ vulnerabilities 2.5x more common in AI-generated code, with monthly findings growing tenfold between December 2024 and June 2025. Aikido's 2026 survey found one in five organizations had already had a security incident traceable to AI-generated code.
None of this says AI writes bad code. It says something narrower and more useful: the default agent workflow is incentivized to close a ticket, not to own a codebase. An agent optimizes for a happy path, a passing test, a merged diff. Nothing rewards it for noticing that the function it just wrote already exists three files over, or that the error it swallowed should have propagated. Those behaviors are precisely what determine what a system costs to own in year three.
Recall the Sonar figure: maintenance is 19% of engineering time at small organizations and 32% at large ones. The signals above are a forecast of that ratio moving in one direction.
This is the part I find genuinely hard, and the reason the original post was worth expanding.
As agents get more capable, the practical question stops being whether to use them. It becomes this: you changed the model, the prompt, the tool definitions, the skills, or the harness, so did that make the system better?
That question is harder than it sounds, for five compounding reasons.
The clean experiment is gone. In July 2025 METR ran the most rigorous study in this area, a randomized controlled trial with 16 experienced developers across 246 real tasks in repositories they had worked in for an average of five years. The result: developers were 19% slower with AI allowed. They had forecast 24% faster and, after finishing, still estimated 20% faster, a roughly 40-point perception gap.
That study is now widely cited as proof AI does not work. It is not, and METR labels it historical. What happened next matters more. They ran a larger follow-up from August 2025, and in February 2026 publicly withdrew confidence in their own design. The reason: between 30% and 50% of developers were declining to submit tasks because they did not want to do them without AI. Some refused to participate at all. One completed none of their AI-disallowed assignments.
The experiment failed because the control condition became unacceptable to the subjects. That is not a problem you can engineer around, and it applies to your team too.
Self-report is biased by a known, large margin. Roughly 40 points, per the study above. METR's May 2026 survey of 349 technical workers found a median self-reported speed gain of 3x but a value gain of only 1.4x to 2x, and on inspecting actual public output, judged several of the highest self-reports overstated.
Task mix drifts underneath you. As agents get cheaper, teams take on work that was not worth doing before. Output rises, measured speed rises, and delivered value rises much less. Any period-over-period comparison that does not hold task type constant is measuring your backlog, not your agents.
Changes are confounded. Teams rarely change one variable. A new model ships the same week someone rewrites the system prompt and adds two tools. If you only observe aggregate output, you cannot attribute the delta, and you will carry forward changes that did nothing.
Public benchmarks have stopped discriminating. Stanford's AI Index 2026 records SWE-bench going from roughly 60% to near 100% in a single year. A benchmark that everything passes tells you nothing about which option is better for your repository, your conventions, and your reviewers. Benchmark performance and merge rate in your codebase are different quantities.
Three methods survive the problems above.
One honest caveat. METR's time-horizon work finds that the length of task a frontier agent completes with 50% reliability has been doubling roughly every seven months since 2019, possibly accelerating to about four months across 2024 and 2025. Every capability claim here has an estimable shelf life. The durable question is not which tasks are safe from automation. It is which tasks carry an accountability requirement that survives capability, and that is a question about liability and regulation as much as about intelligence.
Here is what ties the three threads together.
The models will keep changing. So will the prompts, the tool definitions, the skills, and the harness. Anything you learn about a specific configuration expires on the next release, and given a seven-month doubling, it expires fast.
What does not expire is the record of what your agents proposed, what your reviewers merged, what they rewrote, what they rejected, and what later broke. That data is specific to your codebase and your standards. It is the only ground truth that tells you whether a change helped you rather than helped a leaderboard. And unlike benchmark scores, it accumulates. Every merged and rejected change makes the next evaluation sharper.
That is the practical version of the argument. Perfect code generation caps out at 1.25x because generation was never the constraint. The constraint is now specification quality on one side and verification capacity on the other. Both are measurable. Neither is measured by anything on a standard engineering dashboard.
Three things follow for engineering leaders.
Review capacity is your delivery ceiling. If PR volume doubled this year and your review process did not change, that is where your next incident is forming. The 31% of PRs merging unreviewed is the pressure valve opening, and it is invisible on a velocity dashboard right up until it is not.
Maintainability is being borrowed against, not paid. Refactoring down 70%, legacy maintenance down 74%, duplication up 81%. Throughput books this quarter. The cost books in year three, superlinearly with codebase size.
Instrument authorship and outcomes now. Not because AI code is bad, but because you cannot manage what you cannot attribute, and the industry baselines to compare against finally exist.
One footnote is worth sitting with. Microsoft's study asked 242 developers what they most wanted automated. The ranking: documentation (82 mentions), environment setup (66), writing tests (60), task tracking (47), security and compliance (40). Code review came ninth. Debugging eleventh.
Code generation, which nobody put near the top, was automated first. Not because it was the biggest cost, but because it was the easiest thing to benchmark.
That is worth remembering the next time a benchmark score is offered as evidence of engineering progress.
Microsoft Research, Time Warp: The Gap Between Developers' Ideal vs Actual Workweeks in an AI-Driven Era (2024). METR, Measuring the Impact of Early-2025 AI on Experienced Open-Source Developer Productivity (arXiv:2507.09089). METR, We Are Changing Our Developer Productivity Experiment Design (February 2026). METR, Measuring the Self-Reported Impact of Early-2026 AI on Technical Worker Productivity (May 2026). METR, Measuring AI Ability to Complete Long Software Tasks (arXiv:2503.14499). Google Cloud and DORA, State of AI-assisted Software Development (2025). Stack Overflow, 2025 Developer Survey. GitClear, AI Copilot Code Quality (2025) and The Maintainability Gap (2026). Veracode, 2025 GenAI Code Security Report. Apiiro AI code security analysis (2025). Aikido, State of AI in Security and Development (2026). LinearB, 2026 Software Engineering Benchmarks Report. Faros AI, The AI Productivity Paradox (2025). CircleCI 2026 delivery data. Sonar developer time-allocation survey and 2026 State of Code Developer Survey. Stanford HAI, AI Index 2026.
On source quality. Faros, LinearB, GitClear, CircleCI, Veracode, and Aikido all sell tooling into the problems they measure. Their telemetry is large-sample and, as far as I can tell, sound, but the framing is not disinterested, and I have named each so you can weigh it yourself. The academic and non-profit sources (Microsoft Research, METR, Stanford HAI) carry different limitations: small samples, single-company populations, and in METR's case an explicit retraction of confidence in their own second study. I have tried to note where the evidence is contested rather than only where it is convenient.
Disclosure: I run LogicStar, which builds tooling in the code review and verification space. That is why I care about this data, and you should read section 4 knowing it. Every figure above is independently checkable, and the METR reversal cuts against the tidy version of this story.

Build an Agentic SDLC you can trust. Prove where agents can work without additional human review.
A forward-deployed engineer, plus the platform, measured on your own repositories.
Manage settings
.png)